A basic model for the study of Schmallenberg disease
A System Dynamics Based Model
Giuseppe Noce
nocegius@teletu.it
In the second semester of 2011 a new virus circulated in domestic and wild ruminants. The virus has been called “Schmallenberg virus” and it is included in the Simbu serogroup of the Bunyaviridae family, genus Orthobunyavirus. At the moment the clinical signs are non-specific having observed only malformations of newborns especially in sheep and less frequently in goats and in cows.
This new disease (caused by this virus) has been confirmed in eight European Union Member States (MS) (France, Belgium, Germany, Italy, Luxemburg, The Netherlands, Spain and the United Kingdom). Each MS has a web site in which it is possible to find more information. Epidemiological information is not much. EFSA has elaborated a report in which the available data is reported. With this data and the System Dynamics technique an early model, describing the behaviour of the Schamallenberg disease, has been developed.
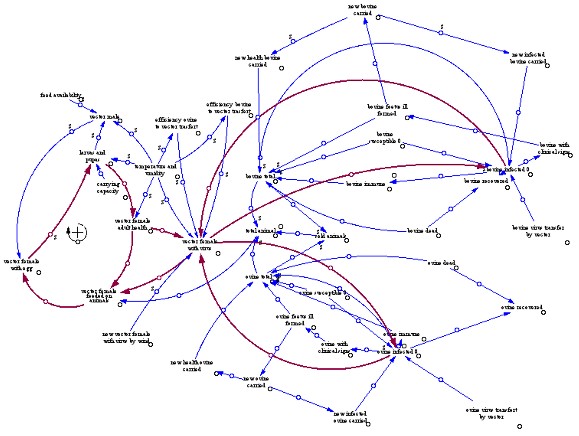
The SIR Model is used to simulate the evolution of the infection between vectors and animals (bovine and ovine). The below picture represents the links between the model elements including vector growth.
The model simulates what happens if infectious vectors come into a population of bovines and of ovines. If the model is run for a year it describes a disease time distribution like this
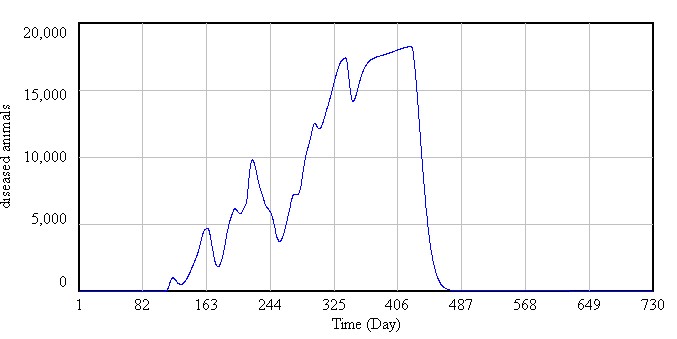
We can see that the diseased animals are mostly in the end of year because of the time necessary for the vectors to multiply, become infected and spread as well as the clinical manifestation of the Schmallenberg disease.
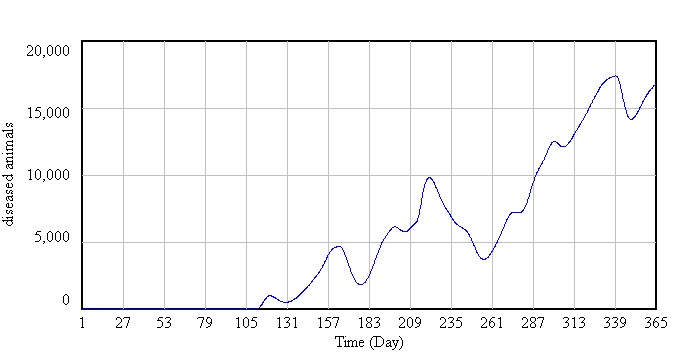
While if the model run for two years we can see that the disease spread finishes in the first quarter of the new year and the peak of disease is around January and February.
A step of model building is the model validation. EFSA data was used to validate the model.
EFSA distribution was on confirmed herd (herd in which there was at least one animal with clinical signs), and is reported below.
So we can see that the peak of disease is January and February. But now we have no information about any new spread of this disease.
Is this model able to produce knowledge on this new disease, is it ready to achieve its objectives ? Although the peak of the model and EFSA distribution seem to occur in the same period, we can ask why this is so. Is it because the model fits, or because the data is insufficient ?
Reference/bibliography.
E.M. Boriani, G.Noce, R. Berchi -
Studio del ciclo di vita dei ditteri ematofagi con l'utilizzo della System Dynamics -
in Atti II Workshop Nazionale di Epidemiologia Veterinaria “Medicina umana, medicina veterinaria e tutela dell'ambiente possibili sinergie in sanitŕ pubblica”. Perugia 12-13 giugno 2006, 30
Technical report "Schmallenberg" virus: analysis of the epidemiological data Supporting Publications 2012:EN-261 on http://www.efsa.europa.eu/it/supporting/doc/261e.pdf
|