4.15. QUALITY CONTROL GUIDE WITH VENSIM
A simulation model with Vensim
 The company ECOCHIP is medium sized company dedicated to the fabrication of integrated circuits. Integrated circuits are small electronic components of semiconductor materials that have the same features as complete electric circuits (amplifiers, oscillators etc). Because of the delicate production process employed, only 30 - 50% of the production is usable. For this reason all the units produced need to pass through quality control before being sold.
The company is concerned about the repercussion of the quality of the products on the image of the company. ECOCHIP has observed that on occasions buyers have returned many defective products, while during other times, few products have been returned.
The company's solicitors are very aware of the situation and when they perceive an increase of the returns and reclamations of the product, they contract more personnel to work in the final stages of quality control to increase the effectiveness of this process. The amount of new hiring is conditioned by the existing number of controllers and the frequency of the reclamations received (06).
The major difficulty of the final control process requires some months of preparation and training, even though some controllers learn more quickly than others. The controllers on the training course do not check integrated circuits that are going to be sold because ECOCHIP doesn't want to run the risk that the inexpert controllers let defective components pass the control. The new employees that receive training are instructed by the expert controllers. An experienced controller assigned the task of teaching new employees should dedicate half of his time to this task and the rest of the time should go towards the usual controls of finished products.
ECOCHIP doesn't have a specific policy to reduce the number of controllers, but the natural dynamic of this department corrects the excesses in personnel that can be produced (02).
Currently, the strong demand obliges the controllers to continue in their work same rhythm as the production process. For this reason the time dedicated to the final checks depends on the volume of production (10).
The clients appear to perceive fluctuations in the quality of ECOCHIP products. In this way during some periods, clients return many defective products and during other periods they receive very few returns.
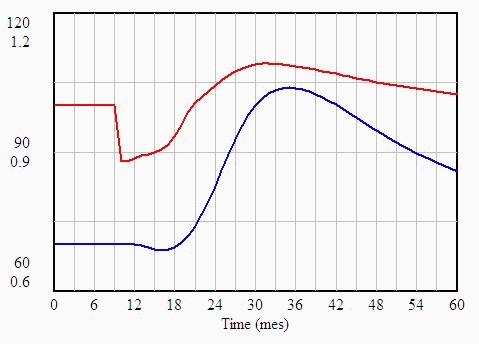
The previous implies that a good model should demonstrate a trend towards the fluctuation in the quality of ECOCHIP's products. When the number of controls per employee increases due to an increase in sales, the final quality decreases. Some time later, new controllers are contracted. Initially, this increase in new controllers reduces the number of effective controllers until the new controllers are capable of helping in the control. The new training tasks decrease further the observed quality. Nevertheless, when the period of training is over, the number of controls per employee decreases and the observed quality increases.
We have the following qualitative information:
- There are currently 80 controllers with 20 controllers in training (07) (09)
The company ECOCHIP is medium sized company dedicated to the fabrication of integrated circuits. Integrated circuits are small electronic components of semiconductor materials that have the same features as complete electric circuits (amplifiers, oscillators etc). Because of the delicate production process employed, only 30 - 50% of the production is usable. For this reason all the units produced need to pass through quality control before being sold.
The company is concerned about the repercussion of the quality of the products on the image of the company. ECOCHIP has observed that on occasions buyers have returned many defective products, while during other times, few products have been returned.
The company's solicitors are very aware of the situation and when they perceive an increase of the returns and reclamations of the product, they contract more personnel to work in the final stages of quality control to increase the effectiveness of this process. The amount of new hiring is conditioned by the existing number of controllers and the frequency of the reclamations received (06).
The major difficulty of the final control process requires some months of preparation and training, even though some controllers learn more quickly than others. The controllers on the training course do not check integrated circuits that are going to be sold because ECOCHIP doesn't want to run the risk that the inexpert controllers let defective components pass the control. The new employees that receive training are instructed by the expert controllers. An experienced controller assigned the task of teaching new employees should dedicate half of his time to this task and the rest of the time should go towards the usual controls of finished products.
ECOCHIP doesn't have a specific policy to reduce the number of controllers, but the natural dynamic of this department corrects the excesses in personnel that can be produced (02).
Currently, the strong demand obliges the controllers to continue in their work same rhythm as the production process. For this reason the time dedicated to the final checks depends on the volume of production (10).
The clients appear to perceive fluctuations in the quality of ECOCHIP products. In this way during some periods, clients return many defective products and during other periods they receive very few returns.
The previous implies that a good model should demonstrate a trend towards the fluctuation in the quality of ECOCHIP's products. When the number of controls per employee increases due to an increase in sales, the final quality decreases. Some time later, new controllers are contracted. Initially, this increase in new controllers reduces the number of effective controllers until the new controllers are capable of helping in the control. The new training tasks decrease further the observed quality. Nevertheless, when the period of training is over, the number of controls per employee decreases and the observed quality increases.
We have the following qualitative information:
- There are currently 80 controllers with 20 controllers in training (07) (09)
- Each controller stays in the company for an average of 16 months. (02) (19)
- Four months of training are necessary for a controller in training to become a qualified controller. (12) (20)
- The value of acceptable quality is 1 (03)
- Currently, 7000 chips are produced each month, this amount corresponds exactly with the number of orders.
- A test will be carried out simulating that from period 10, an increase of 700 chips will be ordered each month.
- Each of these units will be considered as a reclamation.
- The returns will be received with a delay of 3 months. (18)
- The observable quality has a delay of 3 months over the value of the current quality.
- The production is adjusted to the average of the orders in the last 6 months. (15)
- The orders that are received are due to the observable quality.
- We will analyse a period of 60 months.
Based on this information:
1) Study the situation described and explain a concise summary of the problem and of the behaviour of the model. Identify the management policies that could cause this behaviour.
2) Develop a brief causal diagram will be developed based on the analysis.
3) Create the corresponding flow diagram and compare it with the diagram that we are about to see. In the diagram the variables that are going to incorporate the internal tables underlining the name of the variable are drawn and the delays have been signalled in the arrows.
4) Write the equations in the format that will be presented shortly. Take special note in this practical case of the use of Internal Tables, Delays, Functions, and an element of the test to examine different scenarios. The test is activated if the time of the function Step is inferior to the horizon of the simulation.
5) Execute the model on the computer. Compare the behaviour obtained with the behaviour expected based on your analysis.
6) Experiment with structural changes or with the parameters employed that can alleviate the problem. Define that modifications in the management policies employed can offer a more stable quality of the products. We want to minimise the fluctuations of quality in order to maximise the volume of orders.
|

 See the book